Geodemographics - blogs and resources
Visit the Geodemographics Knowledge Base (GKB) for expert blogs and links to useful sources of geodemographic data and knowledge.

If, like me, you often find yourself wandering around different parts of the country wondering why certain areas look similar or different to others, or if your job requires you to identify what types of people work in different areas and what their characteristics are, you may well be interested in taking a look at the Classification of Workplace Zones for England and Wales (COWZ-EW).
COWZ-EW is a geodemographic classification of Workplace Zones (WZs) for England and Wales. It is based on the characteristics of workers and their workplaces, as recorded in the 2011 Census. It identifies the ways in which areas are similar or different to one another in terms of the characteristics of people who work there (e.g. hours worked, whether they are employed or self-employed, their highest level of qualification, ethnicity, etc.) and the characteristics of the workplaces in the area (e.g. industrial sector, mixed-use versus predominantly workplace or residential etc.). As such, it is potentially extremely useful for applications such as retail, transport, emergency planning/response and health and many other sectors.
There are, of course, already numerous other geodemographic classifications, such as the 2001 and 2011 Output Area Classifications, CACI’s Acorn and Experian’s Mosaic, so what makes COWZ-EW unique? Most of these existing classifications are based on the characteristics of households and residential areas; by comparison, the aim of COWZ-EW is to provide users with unique insights into the characteristics of workers and workplaces, at the small area level. It does this by exploiting the rich set of data provided for WZs in the 2011 Census. For the first time ever, workplace data from the Census were published using a set of geographical areas (WZs) which had been specifically designed for this purpose. This enabled the Office for National Statistics (ONS) to overcome statistics disclosure challenges and to release 21 tables for WZs rather than just 4 for Output Areas (OAs) from the 2001 Census. As a result, users are now able not only to explore a much wider range of data about workers and workplaces, but also to map them using a much more appropriate set of geographical units. In city centres, for example, WZs provide a much finer level of granularity for analysis than OAs did previously.
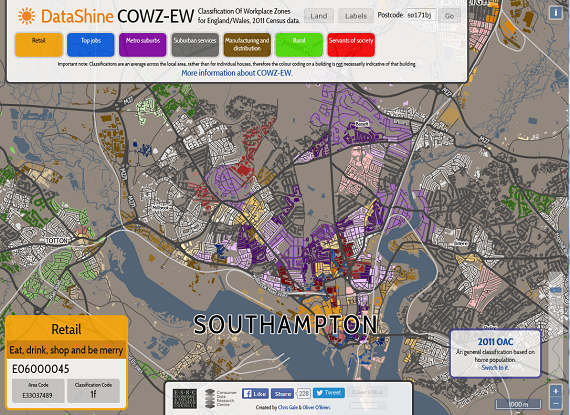
 Figure 1:COWZ-EW – via the DataShine visualisation interface
DataShine COWZ-EW created by Chris Gale and Oliver O’Brien. Uses data from Office of National Statistics (Crown Copyright, OGL), Ordnance Survey (Crown Copyright & Database right, OGL), OpenStreetMap (Copyright OSM contributors, CC-By)
As it is based entirely on 2011 Census data, COWZ-EW is freely and openly available to users in all sectors. It has been developed using traditional geodemographic methods and is deliberately based on methods similar to those used to produce OAC in order to facilitate comparison and ensure consistency. Following detailed exploratory analysis of the geographical and statistical patterns in the data, 48 Census variables were selected for their ability to differentiate different types of workers and workplaces. A k-means clustering technique was then used to generate 7 Supergroups and to subsequently subdivide each of these into a varying number of Groups, giving 29 Groups in total. Details of the specific methodology can be found in the COWZ-EW User Guide. Pen portraits, radial plots and illustrative examples are also provided for each Supergroup and Group.
A couple of observations and ‘health-warnings’, based on our own experiences of exploring the data:
· There are very clear spatial patterns in terms of the characteristics of workers and workplaces in different areas and these are well-reflected in the different Supergroups and Groups.
· Workplace-related variables have some of the lowest quality and accuracy ratings in the Census but, reassuringly, from our detailed interrogations of the data here, the WZ data do appear to be robust and sensible.
· When exploring COWZ-EW, do remember that it is based on the characteristics of both workplaces and workers. In ‘ground-truthing’ the classification, we have noted that our own prior expectations of which class an area is likely to belong to are strongly driven by the type of industry in the area. This is perhaps not surprising, given that it is the most visually obvious characteristic of the area, whereas we cannot easily know about the characteristics of the workers. It must therefore be remembered that this is far more than just a classification of industry type: it is a classification of a broad range of worker and workplace characteristics!
· Remember too that, as with most geodemographic classifications, clusters are determined based on how similar or different the area is to others across the entire country (England and Wales in this instance). Therefore, when a class is identified as having a ‘relatively high percentage of self-employed workers’, for example, it does not necessarily mean that it has very high absolute number (or percentage) of self-employed workers. It's all relative! The radial plots, examples and pen portraits available from the COWZ-EW website are the best way to really get to grips with the distinctive features of each class.
· Note that ONS are currently producing a set of WZs for Scotland and Northern Ireland, in collaboration with National Records of Scotland (NRS) and the Northern Ireland Statistics and Research Agency (NISRA). Once these have been approved, we will produce a UK-wide version of COWZ. This will be quality-assured by ONS and then released by them as part of their family of open national area classifications.
Finally, I’d like to pose you a couple of challenges:
1. Go to the DataShine COWZ-EW website, pick some areas with which you are familiar, and explore COWZ-EW. Is it what you expected? What can you find out about the area?
2. If you are in a job that might make use of COWZ-EW, download the data, experiment with it and see whether it can help you in your work.
Lastly, next time you find yourself wandering around the country, pondering why things look the way they do, don’t forget to check out COWZ-EW: you might just learn something new about the area!
We would very much value feedback on COWZ-EW: please contact us at cowz@geodata.soton.ac.uk

Visit the Geodemographics Knowledge Base (GKB) for expert blogs and links to useful sources of geodemographic data and knowledge.


Our newsletters cover the latest MRS events, policy updates and research news.
0 comments